> ## Documentation Index
> Fetch the complete documentation index at: https://docs-docflow.textin.ai/llms.txt
> Use this file to discover all available pages before exploring further.
# Parsing Result Visualization
> How to obtain precise coordinates from parsing results and display them on the interface
This document continues from the [previous section](./quickstart), explaining how to process parsing results after obtaining them and draw text boxes at corresponding positions on the original file.
This document uses [this sample document](https://dllf.intsig.net/download/2025/Solution/20250829/simple.pdf) as an example to explain how to draw text boxes on the original file image.
Please install dependencies before running the example code:
`pip install PyMuPDF pillow requests`
## Example Code
```python Python expandable icon=python lines theme={null}
import requests
import json
import os
import fitz # PyMuPDF
from PIL import Image, ImageDraw
ti_app_id = "your_app_id"
ti_secret_code = "your_app_secret"
workspace_id = "your_workspace_id"
file_id = "your_file_id"
host = "https://docflow.textin.ai"
url = "/api/app-api/sip/platform/v2/file/fetch"
params = {
"workspace_id":workspace_id,
"with_document": "true",
"file_id":file_id
}
resp = requests.get(url=f"{host}{url}",
params=params,
headers={"x-ti-app-id": ti_app_id,
"x-ti-secret-code": ti_secret_code,
})
resp_json = json.loads(resp.text)
def extract_pages_from_docflow(document):
pages_out = []
for page in document.get("pages", []):
pages_out.append({
"width": page.get("width", 0),
"height": page.get("height", 0),
"angle": page.get("angle", 0),
"lines": page.get("lines", [])
})
return pages_out
def pdf_to_images(pdf_path, output_dir="./docflow_pages", dpi=144):
os.makedirs(output_dir, exist_ok=True)
doc = fitz.open(pdf_path)
zoom = dpi / 72.0
mat = fitz.Matrix(zoom, zoom)
image_paths = []
for i, page in enumerate(doc):
pix = page.get_pixmap(matrix=mat)
img_path = os.path.join(output_dir, f"page_{i+1}.png")
pix.save(img_path)
image_paths.append(img_path)
doc.close()
return image_paths
def draw_quads_on_image(image_path, quads, page_width, page_height, color=(26,102,255), line_width=2):
image = Image.open(image_path).convert("RGB")
draw = ImageDraw.Draw(image)
img_w, img_h = image.size
scale_x = img_w / page_width if page_width else 1
scale_y = img_h / page_height if page_height else 1
for q in quads:
pos = q.get("position")
if pos and len(pos) == 8:
points = [
(pos[0]*scale_x, pos[1]*scale_y),
(pos[2]*scale_x, pos[3]*scale_y),
(pos[4]*scale_x, pos[5]*scale_y),
(pos[6]*scale_x, pos[7]*scale_y),
(pos[0]*scale_x, pos[1]*scale_y)
]
draw.line(points, fill=color, width=line_width)
out_path = image_path.replace('.png', '_boxed.png')
image.save(out_path)
return out_path
# Select the original PDF to visualize (same file as parsed)
pdf_path = "./simple.pdf" # Please replace with your original PDF path
# Extract coordinate data
files = resp_json.get("result", {}).get("files", [])
if not files:
raise RuntimeError("No file parsing results obtained")
document = files[0].get("document", {})
pages = extract_pages_from_docflow(document)
# Convert to images and draw coordinates
image_paths = pdf_to_images(pdf_path, output_dir="./docflow_pages")
annotated = []
for i, page in enumerate(pages):
if i >= len(image_paths):
break
out_path = draw_quads_on_image(
image_paths[i],
page["lines"],
page["width"],
page["height"]
)
annotated.append(out_path)
print("Annotated images output:", annotated)
```
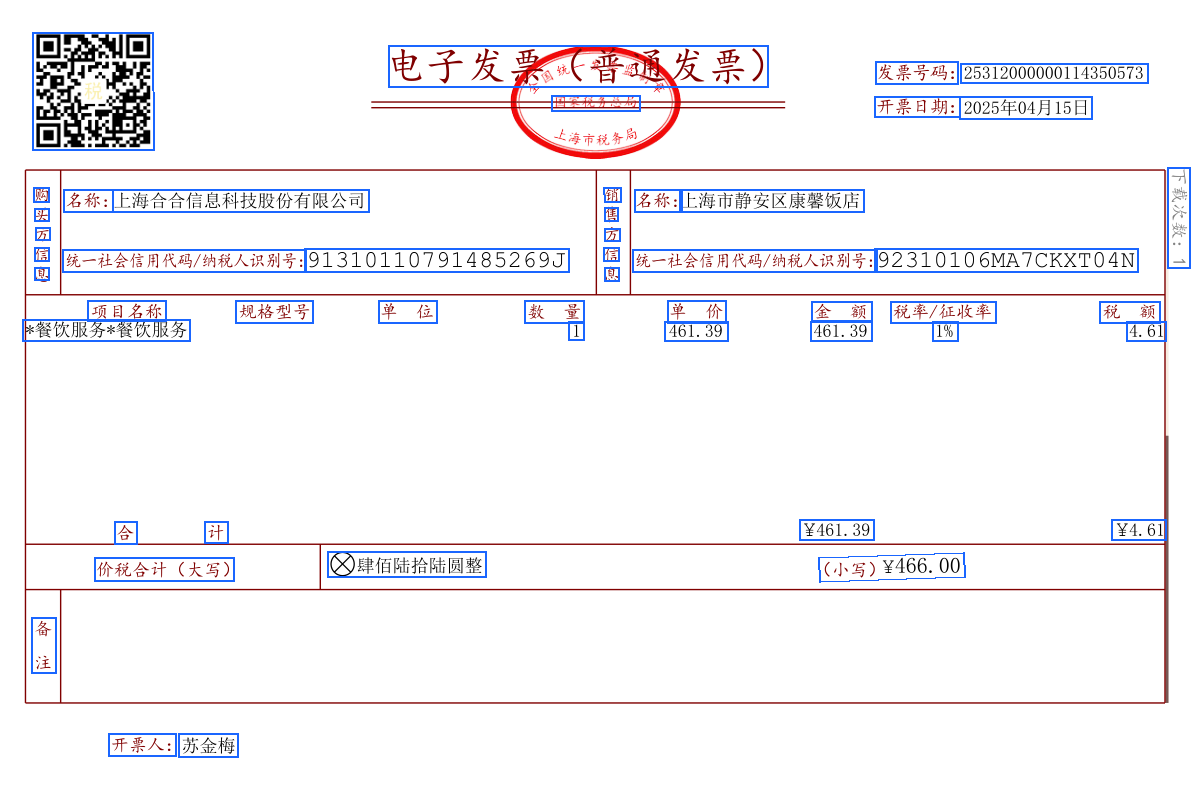
In the output directory, you can see the rendering effect of text boxes:
 ## Example Code Logic
* **Get parsing results**: Call the result retrieval interface with `with_document=true` enabled to get `result.files[].document`.
* **Extract pages and coordinates**: Read `width/height/angle` and `lines[]` from `document.pages[]`; each `line.position` is `[x1,y1,x2,y2,x3,y3,x4,y4]` clockwise four-point coordinates.
* **Prepare base image**: Use the same file as parsing to generate page images. If converting images yourself, remember to record the rendered `img_width/img_height`.
* **Coordinate scaling**: Calculate `scale_x = img_width / page.width`, `scale_y = img_height / page.height`, and scale the returned coordinates proportionally to the base image pixel coordinate system.
* **Draw visualization**: Draw the scaled four points as closed polylines (or filled polygons) on the corresponding page image line by line, with configurable line width, color, and transparency.
* **Output and display**: Save annotated images, or overlay rendering in frontend canvas/SVG/Canvas; ensure page-by-page correspondence.
* **Optional enhancements**:
* Handle `angle` rotation: If the base image is not rotated correctly, coordinate rotation correction based on `page.angle` is needed.
* Multi-type coloring: Different element types can use different colors/legends; if there are table, image, and other types, they can be differentiated as needed.
* Character-level highlighting: If `charPositions` is returned, scale each character coordinate proportionally and draw for more refined echo effects.
* Performance optimization: Batch drawing, resolution trade-offs, on-demand page rendering to avoid processing too many pages at once causing lag.
* Robustness: Null value checking, coordinate boundary clipping, fault tolerance for network/parsing exceptions.
The above process is language-agnostic. When implementing in other languages, you only need to replace the libraries and APIs for: HTTP requests, JSON parsing, image drawing, and coordinate scaling.
## Example Code Logic
* **Get parsing results**: Call the result retrieval interface with `with_document=true` enabled to get `result.files[].document`.
* **Extract pages and coordinates**: Read `width/height/angle` and `lines[]` from `document.pages[]`; each `line.position` is `[x1,y1,x2,y2,x3,y3,x4,y4]` clockwise four-point coordinates.
* **Prepare base image**: Use the same file as parsing to generate page images. If converting images yourself, remember to record the rendered `img_width/img_height`.
* **Coordinate scaling**: Calculate `scale_x = img_width / page.width`, `scale_y = img_height / page.height`, and scale the returned coordinates proportionally to the base image pixel coordinate system.
* **Draw visualization**: Draw the scaled four points as closed polylines (or filled polygons) on the corresponding page image line by line, with configurable line width, color, and transparency.
* **Output and display**: Save annotated images, or overlay rendering in frontend canvas/SVG/Canvas; ensure page-by-page correspondence.
* **Optional enhancements**:
* Handle `angle` rotation: If the base image is not rotated correctly, coordinate rotation correction based on `page.angle` is needed.
* Multi-type coloring: Different element types can use different colors/legends; if there are table, image, and other types, they can be differentiated as needed.
* Character-level highlighting: If `charPositions` is returned, scale each character coordinate proportionally and draw for more refined echo effects.
* Performance optimization: Batch drawing, resolution trade-offs, on-demand page rendering to avoid processing too many pages at once causing lag.
* Robustness: Null value checking, coordinate boundary clipping, fault tolerance for network/parsing exceptions.
The above process is language-agnostic. When implementing in other languages, you only need to replace the libraries and APIs for: HTTP requests, JSON parsing, image drawing, and coordinate scaling.